DataScientists: a blog about everything data related.
-
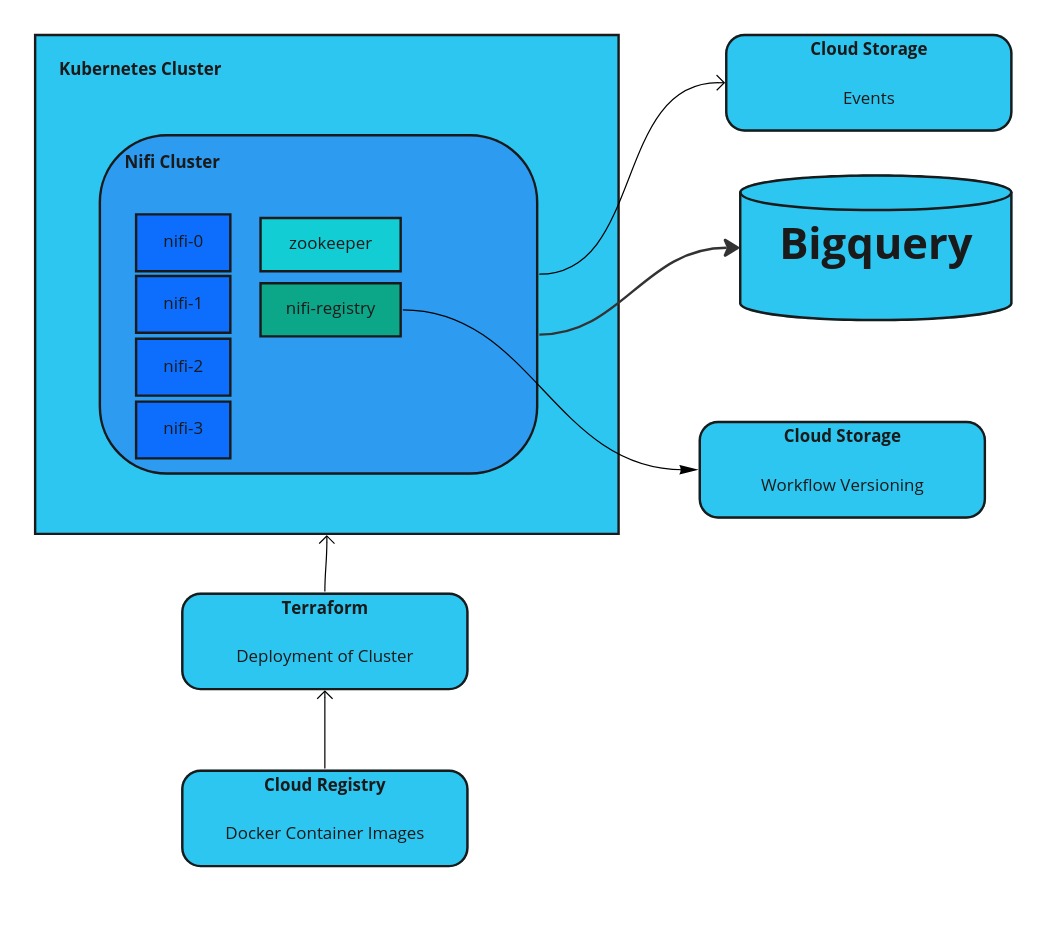
Apache Nifi on Google Cloud Kubernetes Engine (GKE)
Apache Nifi on GKE can be a good solution, if you want to have a low code solution for processing streaming data. If you set it up on GKE, a managed version of Kubernetes, you have a managed scalable environment and do not need to worry about handling the actual servers. Setup of the Apache…
-
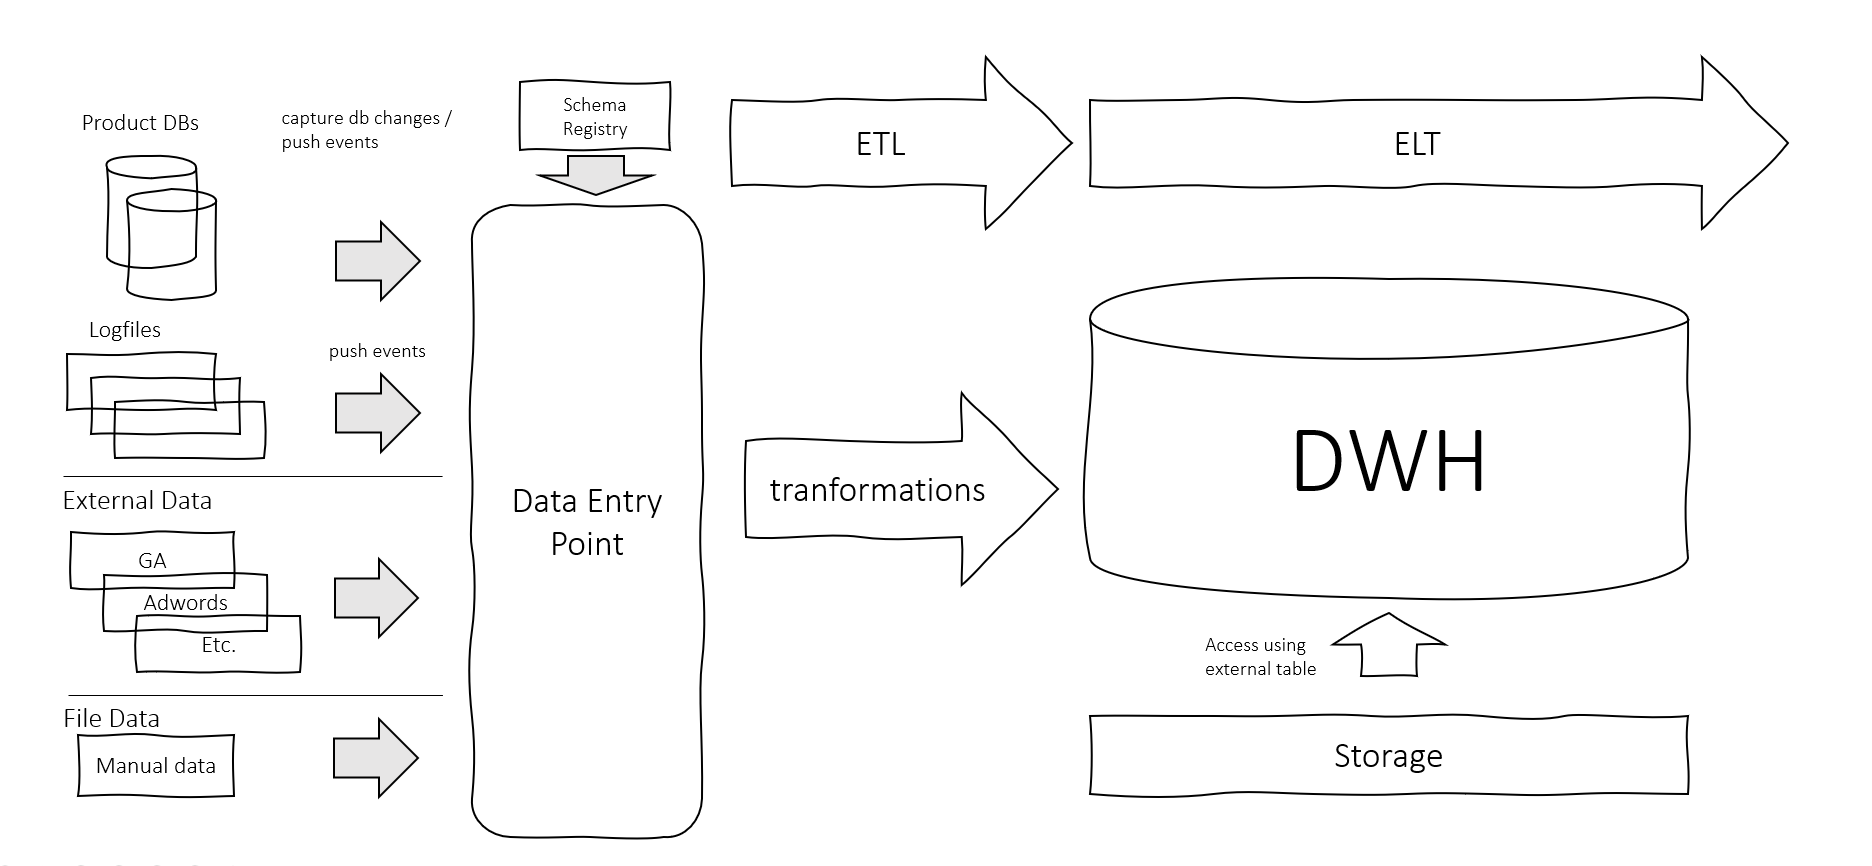
Data Infrastructure in the Cloud
Having your data infrastructure in the cloud has become a real option for a lot of companies, especially since the big cloud providers have a lot of managed services available for a modern data architecture aside from just a database management system.
-

Google Cloud Data Engineer Exam Preparation
This is a little text with all the stuff that helped me prepare for the Google Cloud Data Engineer Exam. There are a lot of courses and resources, that help you in preparing for this. The following links helped me in preparation for my Google Data Engineer Exam. On Coursera there is are several courses…
Got any book recommendations?