Transitioning a machine learning model from an experimental Jupyter Notebook to a highly available, auto-scaling production endpoint is rarely a linear path. In an enterprise environment, this migration introduces severe operational friction—not just in terms of rewriting code, but in handling infrastructure efficiency.
With modern workloads demanding massive compute resources, assigning an entire enterprise-grade GPU (such as an NVIDIA A100 or H100) to a small training job or an idling inference service is financially unsustainable. To build a mature MLOps platform, workflows must be automated, and the underlying hardware must be shared efficiently.
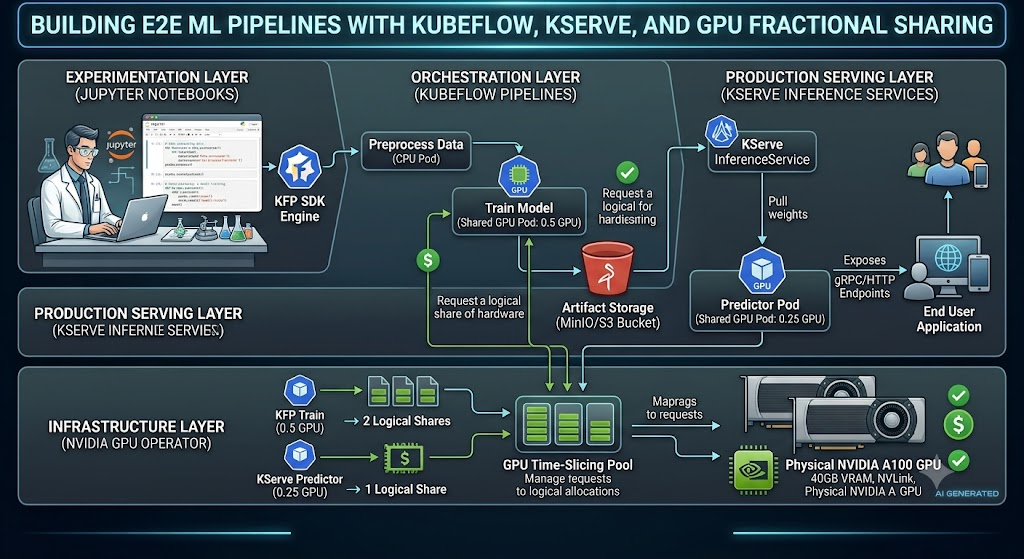
This article provides a complete technical blueprint for building a fully cloud-native MLOps workflow. We will step through building a Kubeflow Pipelines (KFP v2) workflow directly from a Jupyter Notebook, archiving the trained artifact, and serving it as an auto-scaling endpoint via KServe. Crucially, we will implement this architecture using fractional GPU sharing (via NVIDIA GPU Time-Slicing and MIG), allowing multiple pipeline components and inference servers to securely slice and share physical hardware.
Infrastructure Foundation: Configuring Fractional GPU Sharing
Standard vanilla Kubernetes schedulers handle nvidia.com/gpu allocations as strict integers. To bypass this limitation and permit multi-tenant oversubscription, we deployed the NVIDIA GPU Operator configured with custom time-slicing engines. This approach forces the NVIDIA driver to execute multiple distinct compute contexts sequentially via rapid hardware context switching.
We configured our physical A100 infrastructure into a four-slice logical pool. Then we deployed the following ConfigMap directly into our operator’s resource namespace:
apiVersion: v1
kind: ConfigMap
metadata:
  name: time-slicing-config
  namespace: gpu-operator-resources
data:
  a100-4shares: |-
    version: v1
    sharing:
      timeSlicing:
        resources:
        - name: nvidia.com/gpu
          replicas: 4
We enforce this profile by labeling target worker nodes with nvidia.com/device-plugin.config=a100-4shares. Once applied, the core Kubernetes Kubelet advertises a capacity of four logical GPUs for every single physical card.
The primary trade-off with this time-slicing strategy is the total absence of hardware-level memory isolation. Unlike Multi-Instance GPU (MIG), which hard-partitions memory blocks at the silicon level, time-sliced workloads share the same physical VRAM pool. If a rogue pipeline step allocates more memory than its implicit share, it triggers an Out-of-Memory (OOM) fault that crashes all other co-located tenant containers sharing that physical card. We accept this risk for our lighter training and inference workloads to maximize allocation flexibility.
Experimental Orchestration: Pipeline Execution From Jupyter
Our data scientists author their pipelines within managed Jupyter notebooks running on the cluster. The code block below defines a two-step directional acyclic graph (DAG) via the KFP v2 domain-specific language (DSL).
The training component connects directly to the time-sliced resource pool by requesting exactly two logical units—representing 50% of the physical GPU capacity—and enforces target node scheduling via a hard node selector.
import kfp
from kfp import dsl
from kfp.dsl import Dataset, Model, Output, Input

@dsl.component(
    base_image="python:3.10",
    packages_to_install=["pandas", "scikit-learn"]
)
def preprocess_data(output_dataset: Output[Dataset]):
    import pandas as pd
    from sklearn.datasets import load_iris

    iris = load_iris(as_frame=True)
    df = iris.frame
    df.to_csv(output_dataset.path, index=False)

@dsl.component(
    base_image="pytorch/pytorch:2.1.0-cuda12.1-cudnn8-runtime",
    packages_to_install=["pandas", "scikit-learn"]
)
def train_model(
    input_dataset: Input[Dataset],
    output_model: Output[Model]
):
    import pandas as pd
    import torch
    import torch.nn as nn
    import pickle
    import os

    device = torch.device("cuda" if torch.cuda.is_available() else "cpu")
    if not torch.cuda.is_available():
        raise RuntimeError("GPU acceleration not detected by PyTorch runtime.")

    df = pd.read_csv(input_dataset.path)
    X = torch.tensor(df.iloc[:, :4].values, dtype=torch.float32).to(device)
    y = torch.tensor(df.iloc[:, -1].values, dtype=torch.long).to(device)

    model = nn.Sequential(
        nn.Linear(4, 16),
        nn.ReLU(),
        nn.Linear(16, 3)
    ).to(device)

    criterion = nn.CrossEntropyLoss()
    optimizer = torch.optim.Adam(model.parameters(), lr=0.01)

    for epoch in range(50):
        outputs = model(X)
        loss = criterion(outputs, y)
        optimizer.zero_grad()
        loss.backward()
        optimizer.step()

    model.to("cpu")
    os.makedirs(os.path.dirname(output_model.path), exist_ok=True)
    with open(output_model.path + ".pkl", "wb") as f:
        pickle.dump(model, f)
    output_model.metadata["framework"] = "pytorch"

@dsl.pipeline(
    name="end-to-end-fractional-gpu-pipeline",
    description="Production-grade resource isolated pipeline execution."
)
def modern_ml_pipeline():
    preprocess_task = preprocess_data()

    train_task = train_model(
        input_dataset=preprocess_task.outputs["output_dataset"]
    )

    train_task.set_gpu_limit(2)
    train_task.add_node_selector_constraint(
        label_name="nvidia.com/device-plugin.config",
        value="a100-4shares"
    )

if __name__ == "__main__":
    kfp.compiler.Compiler().compile(
        pipeline_func=modern_ml_pipeline,
        package_path="fractional_gpu_pipeline.yaml"
    )
To bridge the gap between interactive notebooks and unattended cluster orchestration, we instantiate the KFP client engine inline. This allows us to submit the compiled workflow manifest straight to the active backend orchestrator from the next cell block:
cl = kfp.Client()
EXPERIMENT_NAME = "Fractional-GPU-Optimization"

run_result = cl.create_run_from_pipeline_package(
    pipeline_file_path="fractional_gpu_pipeline.yaml",
    arguments={},
    experiment_name=EXPERIMENT_NAME,
    run_name="pytorch-fractional-gpu-run-01"
)

print(f"Pipeline run submitted: {run_result.run_id}")
run_result.wait_for_completion(timeout=600)
Production Deployment: Serving with KServe
Once the orchestration layer serializes the model weights and registers them into our object store, we instantiate the production serving architecture. We deploy an auto-scaling KServe InferenceService that targets the same underlying time-sliced hardware nodes.
Instead of burning an entire physical hardware slot on an idle model container, we configure the predictor container to consume exactly one logical slot, which maps to 25% of the physical A100. We also inject Knative scale-to-zero directives to reclaim compute pools during traffic droughts.
apiVersion: "serving.kserve.io/v1beta1"
kind: "InferenceService"
metadata:
  name: "torch-iris-service"
  namespace: "kubeflow-user-example"
spec:
  predictor:
    minReplicas: 0
    maxReplicas: 3
    model:
      modelFormat:
        name: pytorch
      storageUri: "s3://ml-pipeline-artifacts/models/torch-iris-service/v1/"
      resources:
        requests:
          cpu: "1"
          memory: "2Gi"
          nvidia.com/gpu: "1"
        limits:
          cpu: "2"
          memory: "4Gi"
          nvidia.com/gpu: "1"
    nodeSelector:
      nvidia.com/device-plugin.config: "a100-4shares"
We execute the deployment command using our infrastructure deployment engine:
kubectl apply -f kserve-inference.yaml
Operational Lifecycle Verification & Metrics
To track whether our platform layers are packing workloads efficiently onto physical hardware, we execute low-level state queries across the cluster during a live run.
Pipeline Verification
During the training phase of the pipeline execution, we poll the active pod specifications. This allows us to confirm that the KFP mutating webhook successfully injected our custom resource limits:
kubectl describe pod -l pipelines.kubeflow.org/v2_component=train-model -n kubeflow
Requests:
  cpu:            2
  memory:         4Gi
  nvidia.com/gpu: 2
Limits:
  cpu:            2
  memory:         4Gi
  nvidia.com/gpu: 2
Serverless Endpoint Rollover
We track the status of the serverless runtime to verify that the ingress routes are mapping correctly and that the endpoint status is ready:
kubectl get inferenceservice torch-iris-service -n kubeflow-user-example
Physical Hardware Profiling
By executing low-level system checks on the physical worker nodes via the NVML runtime libraries, we can watch how multiple separate Kubernetes pods map down to the exact same physical device context.
kubectl exec -it ds-notebook-pod -n kubeflow -- nvidia-smi
| Pipeline Component | Deployment Type | Declared Container Limit | True Physical Allocation Equivalent |
| Jupyter Environment | Persistent StatefulSet | nvidia.com/gpu: 1 | 25% of physical capacity |
| KFP Training Task | Ephemeral Pod | nvidia.com/gpu: 2 | 50% of physical capacity |
| KServe Predictor | Auto-scaling Knative Pod | nvidia.com/gpu: 1 | 25% of physical capacity |
5. Unresolved Technical Deficiencies
Despite hitting our utilization benchmarks two major technical friction points that remain unresolved:
- Cross-Tenant CUDA Context Bleed: We have not found a way to prevent complete memory starvation when multiple workloads execute simultaneous memory allocations on the same card. If our training step scales its batch size up unexpectedly, it allocates memory that overruns the physical limit of the device. This throws immediate CUDA out-of-memory errors into the neighboring KServe prediction pods, crashing our inference endpoints. We are currently hacking around this by forcing strict memory wrapper limits on our internal base images using
torch.cuda.set_per_process_memory_fraction(), but this must be manually maintained across different team configurations. - Knative Scale-to-Zero Cold Start Spikes: When KServe scales an inference pod down to zero to preserve the time-slicing slot, the subsequent wake-up request encounters severe latency penalties. Downloading the underlying PyTorch container image, allocating the logical slot from the operator plugin, and initializing the model weights into shared VRAM takes an average of up to one minute. Our current stopgap is maintaining a minimum replica count of one for critical APIs, which directly undercuts our goal of full resource reclamation during off-peak windows.

